Excelgoodies +44 (0)20 3769 3689

Batch starts on

th

Powerful Business Intelligence for all.

Power BI - Data Analytics, Modeling & Advanced Reporting

18-hour Course | 12 BI Dashboards | 5 Other Projects | View Schedule

View Schedule

Program at a Glance

TOTAL COURSE DURATION

18-hours (9 Sessions, 2 hrs each)

Live Online (Weekdays)

TRAINING SCHEDULE

View Schedule View Schedule

COURSE FEE

£699

Enroll Now

CERTIFICATE

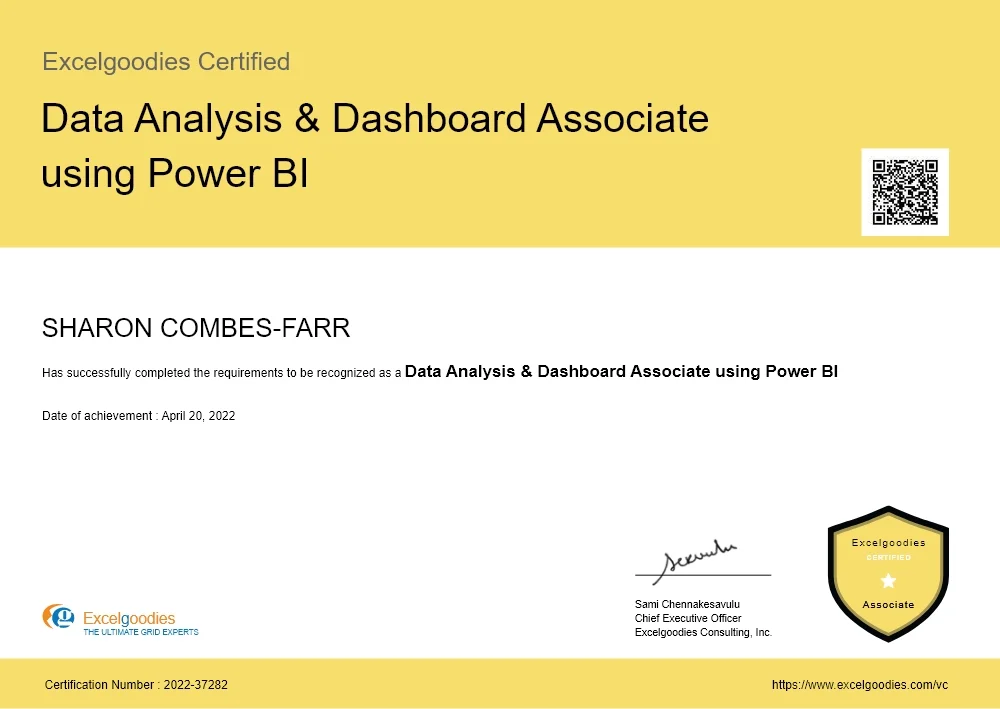
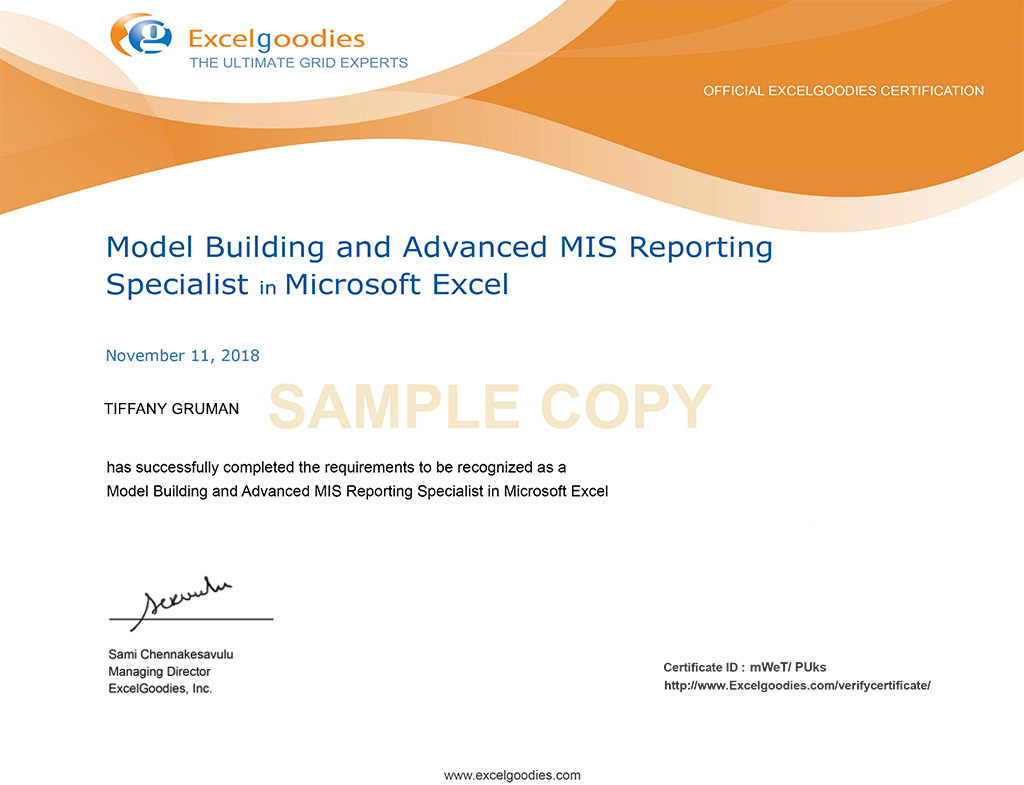
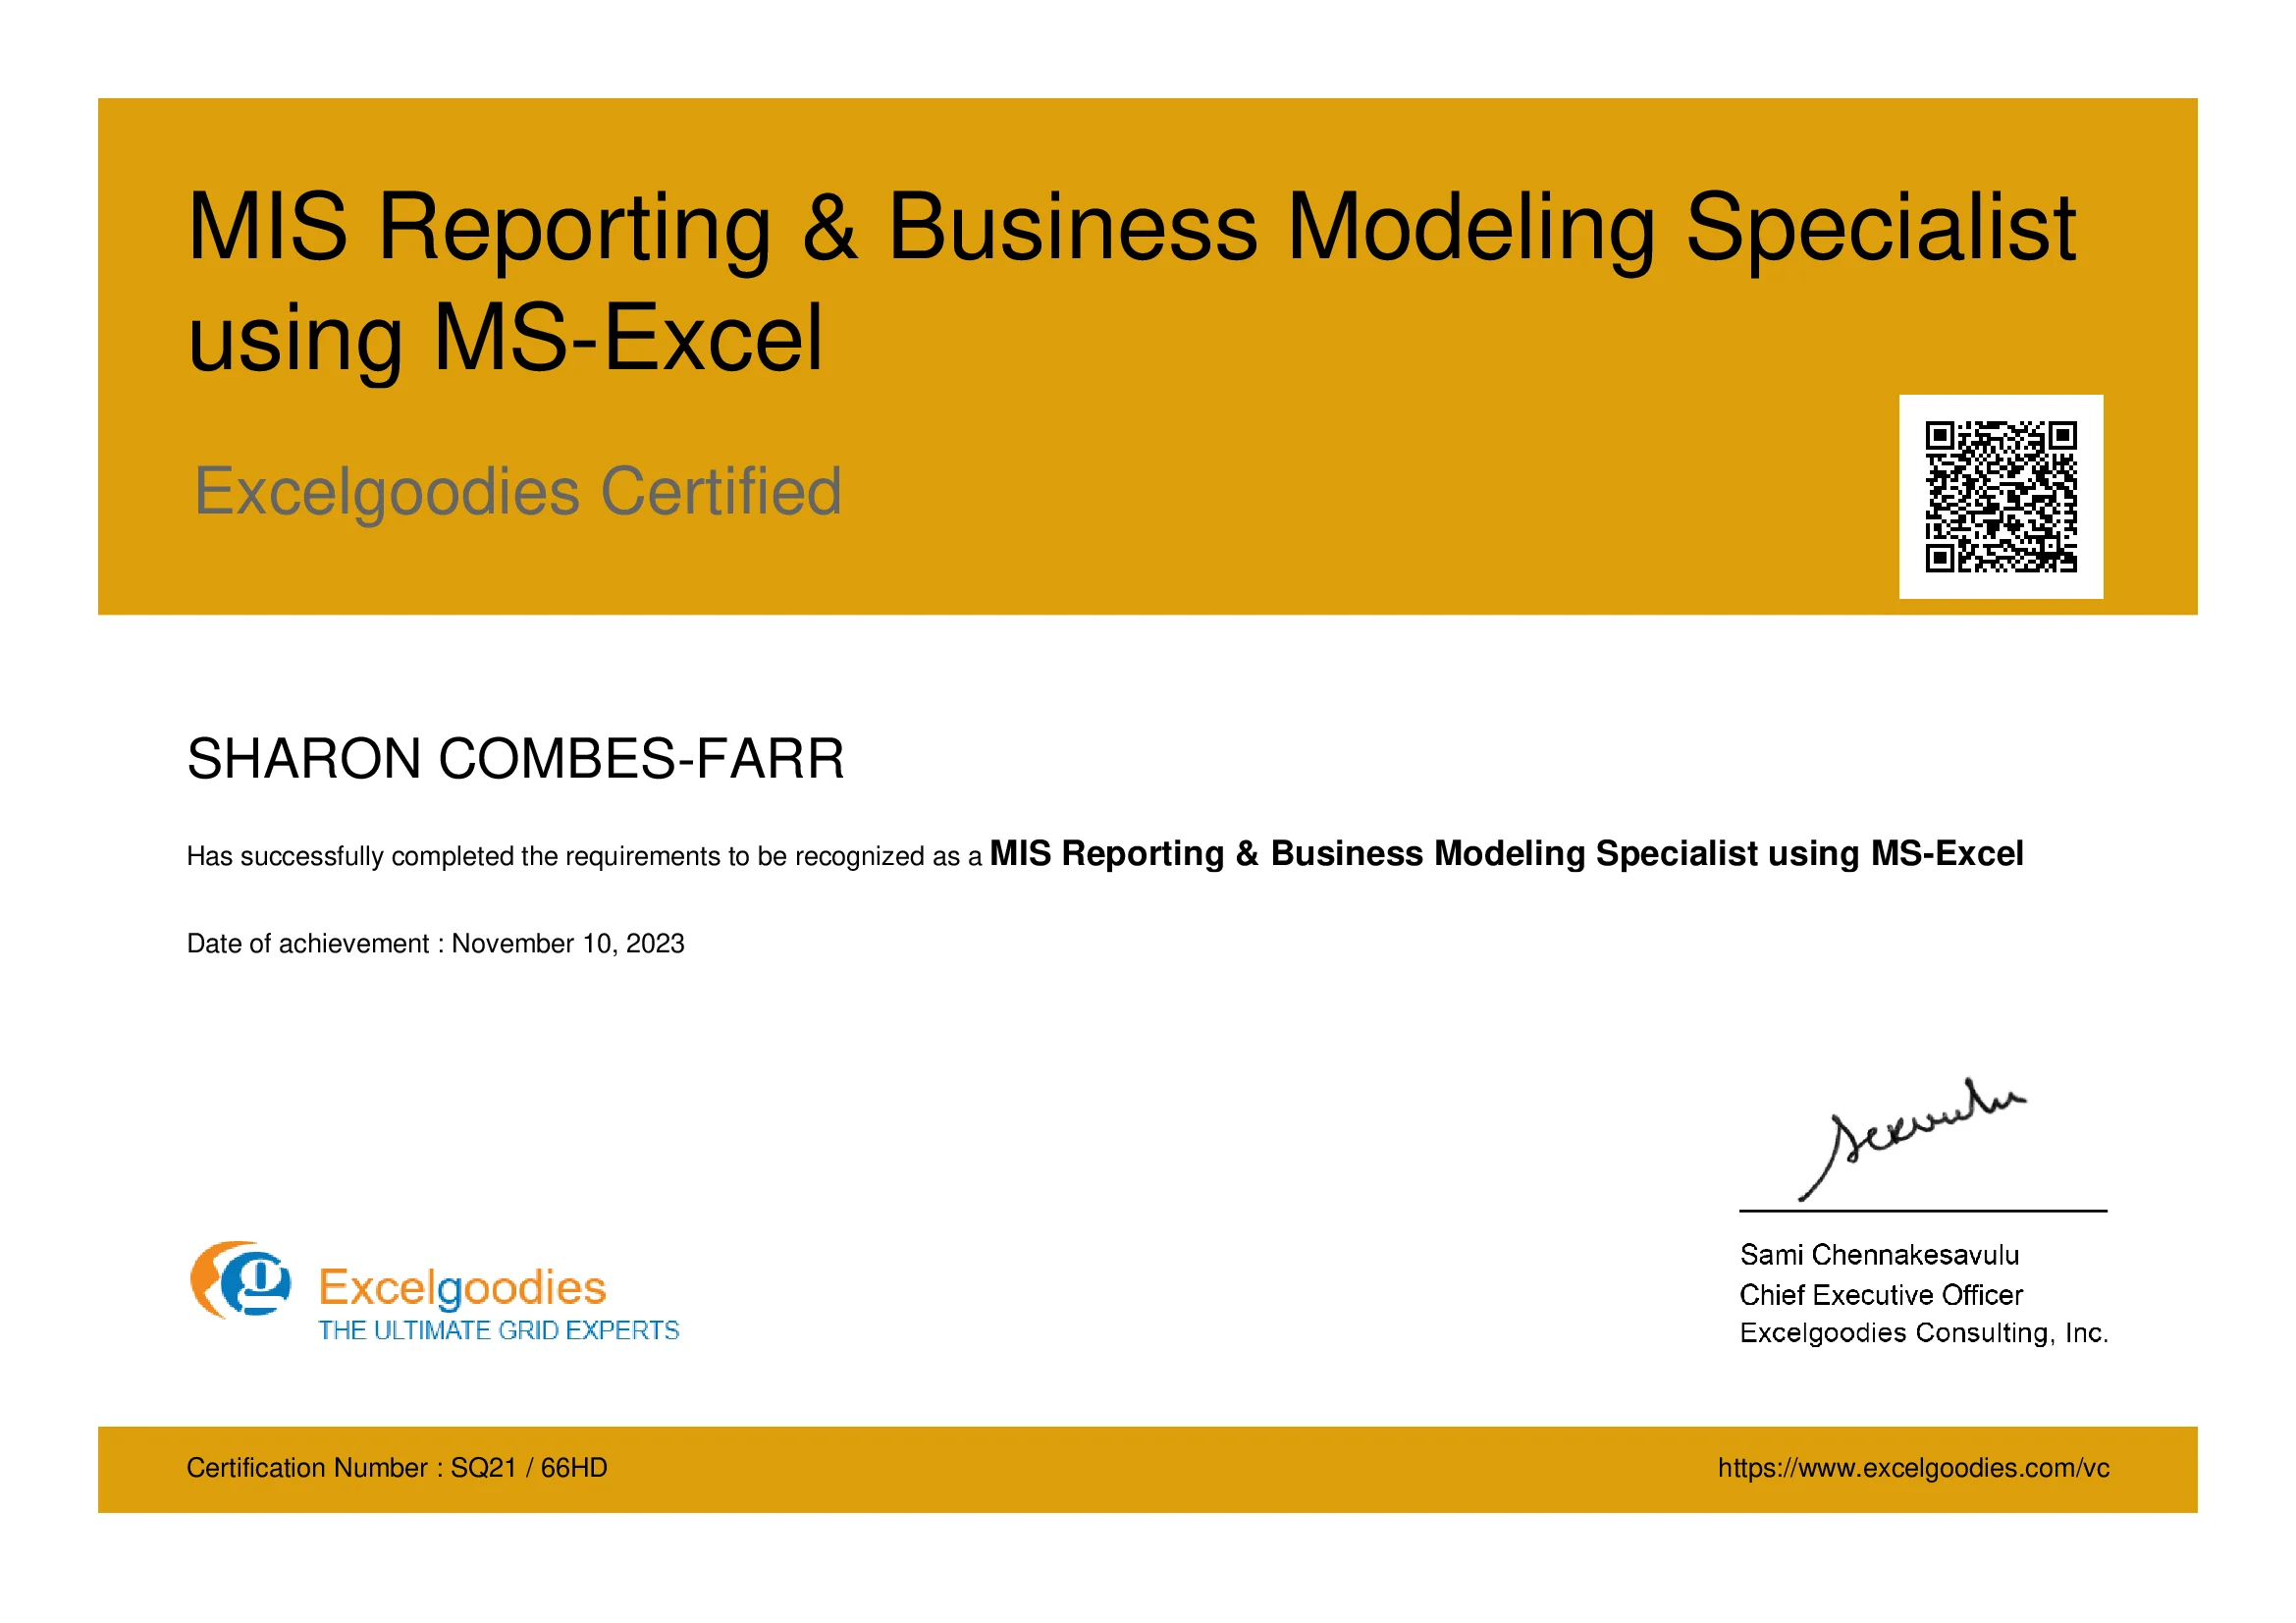
Data Analysis & Dashboard Associate Using Power BI

Sample Certificate

Create a data-driven story with Power BI reports.

From dynamic visualizations to DAX formulas, Power Query transformations, and advanced analysis,
each module is designed to elevate your BI skills. Explore data warehousing using MS-SQL and master
the art of compelling data storytelling - all within this Power BI course.

ExcelGoodies
ExcelGoodies
ExcelGoodies
ExcelGoodies
ExcelGoodies
ExcelGoodies

What will I learn?

Learn how to build and use Power BI business intelligence reports.

Visualization with Power BI

Getting started with Power BI is simple. However, to unlock its full potential, you need a different set of skills. Develop these skills and unlock more insights through improved data analysis and visualization in this section.

ExcelGoodies

Why should I learn Power BI?

DAX Formulas

Add analytical power to your Power BI model that is not available in the data as-is, using DAX. The goal of this section is to teach you basic to advanced features of DAX, providing the knowledge to write formulas for common and advanced business scenarios.

ExcelGoodies

Why should I learn DAX?

Data Transformation with Power Query

Whether you're consolidating multiple data sources, handling diverse data formats, or crafting dynamic queries, this versatile tool ensures efficiency and precision in your data preparation, spanning from data cleansing to advanced transformations.

ExcelGoodies

Why should I learn Power Query?

Data Analysis with Power Pivot

Explore the most powerful tool to build data models, forecast estimates, perform what-if-analysis scenarios, etc. Even without a Power BI license, you can still create powerful and blended reports and share them internally using Power Pivot.

ExcelGoodies

When to use Power Pivot?

Data warehousing using MS-SQL

Data for Power BI can come from many sources, but often the data is hosted in SQL Server. This section will teach you how to write accurate, effective, and robust T-SQL code - the right way, and also understand the logic behind it.

ExcelGoodies

Why should I learn MS-SQL?

Taught by Microsoft Certified Trainers.*

All our classes are live, hands-on, and led by real trainers.

Course Content Overview

A snapshot of what you'll be learning in 2 weeks.

Introduction to PowerBI Building Blocks of Power BI
  • Visualizations
  • Datasets
  • Reports
  • Dashboards
  • Tiles
Getting Comfortable With Power BI Environment
  • Connect to Data Sources in Power BI Desktop
  • Cleaning Irregularly Formatted Date and Transform Your Data With the Query Editor
  • Create a report in Power BI Desktop
  • Publish the report in the Power BI service
Data Modelling with Power BI
  • Fundamentals of Modelling
  • How to Manage Your Data Relationships
  • Create Calculated Columns
  • Optimizing Data Models for Better Visuals
  • Create measures and work with time-based functions
  • Create Calculated Tables
  • Explore Time-Based Data
Visualizations
  • Create and Customize Simple Visualizations
  • How to Use Combination Charts
  • Using slicers
  • Creating Map Visualizations
  • Creating Tables and Matrixes
  • Creating Scatter Charts
  • Creating Waterfall and Funnel Charts
  • Using Gauges and Single Number Cards
  • Charting Options including Formatting with Colors, Shapes, Text Boxes, Images, etc.
  • Creating Interactions Between Visualizations
  • Visual hierarchies and drill-down behaviour
Exploring Data
  • Exploring Data
  • Use Quick Insights in the Power BI service
  • Create and Configure A Dashboard
  • Ask Questions of Your Data With Natural Language
  • Share Dashboards with your organization
  • Display Visuals and Tiles Full-Screen
Power BI and Excel
  • Power BI and Excel
  • Import an Excel table into Power BI
  • Import Excel files with data models and Power View sheets
  • Connect OneDrive for Business to Power BI
  • Excel data in Power BI summary
Publishing and Sharing
  • Publishing and Sharing
  • Publish Reports from Power BI Desktop to the Power BI Service
  • Print and export Power BI dashboards
  • Manually Republish and Refresh Your Data
  • Introducing Power BI Mobile
  • Create a group in Power BI
  • Create a content pack in Power BI
  • Connect to a content pack from a group in Power BI
  • Edit a content pack in Power BI
  • Integrate OneDrive for Business with Power BI
  • Publish a report to the web from Power BI
Introduction to PowerPivot
  • Limitation of Excel Functions
  • Limitation of Excel PivotTable
  • Why PowerPivot?
  • PowerPivot Features - Overview
PowerPivot Environment
  • Opening PowerPivot Environment
  • Understanding External Data Section
  • Understanding Formatting
  • PowerPivot Views
  • Understanding Measures
Taking Data into PowerPivot
  • From Excel
  • From MS Access
  • From Ms-SQL
  • From Custom Query
  • From Text Files
  • From Other Sources
Calculated Columns
  • Calculated Columns
  • Entering Formulas
  • Using AutoComplete Feature
  • Renaming Columns
  • Understanding Tables
Creating Measures
  • Creating Simple DAX Measures
  • Explicit Measure Vs Implicit Measure
  • Referencing Measures in Other Measures
  • Formatting Measures
Manage Data Relationships Working with Multiple Tables Disconnected Tables Creating custom calendars using ADVANCED FILTER() Advanced calculated columns
  • Understanding Relationship Concept
  • JOIN TABLES
  • LEFT JOIN TABLES
  • RIGHT JOIN TABLES
  • Using UNION QUERIES
Data visualization Using
  • Power View
  • Charts, Score Cards and Dashboards
  • Slicers
  • Map Visualizations
  • Data Binding and Formatting
Creating Advanced Dashboards with PowerPivot
Introduction to Microsoft Power Query for Excel Import data from external data sources Import with Standard Connectors
  • Connect to a Text or CSV file
  • Connect to a Web page
  • Connect to an Excel Table/Range
Import Data from a File
  • Connect to an Excel workbook
  • Connect to a Text or CSV file
  • Connect to an XML file
  • Connect to a JSON file
Import Data from a Database
  • Connect to a SQL Server database
  • Connect to an Access database
  • Connect to a MySQL database
Import Data from Online Services
  • Connect to Salesforce Objects
  • Connect to a Sharepoint Online List
  • Connect to Facebook
Import Data from Other Sources
  • Connect to an Excel Table or Range
  • Connect to a Web page
Shape data from Multiple Data Sources
  • Shape or transform a query
  • Refresh a query
  • Combine data from multiple data sources
  • Filter a table
  • Sort a table
  • Group rows in a table
  • Expand a column containing an associated table
  • Aggregate data from a column
  • Insert a custom column into a table
  • Combine multiple queries
  • Merge columns
  • Remove columns
  • Remove rows with errors
  • Promote a row to column headers
  • Split a column of text
  • Insert a query to the worksheet
Performing Calculations using DAX Functions
  • Table-Valued Functions
  • Date and Time Functions
  • Filter Functions
  • Information Functions
  • Logical Functions
  • Mathematical and Trigonometric Functions
  • Statistical Functions
  • Text Functions
  • Time Intelligence Functions
Creating Advanced DAX Measures with Advanced DAX Functions
  • Calculate()
  • All()
  • Filter()
  • IF()
  • Switch()
  • SumX()
Introduction to MS-SQL
  • Creating a Database
  • Understanding Tables and Creating Tables
  • Inserting, Updating and Deleting Data
  • Querying Data
  • Filtering Data
  • Grouping Data
  • Ordering Data
  • Column Aliases
  • Table Aliases
UNDERSTANDING TRANSACT-SQL DATA TYPES
  • Dates
  • Strings
  • Numeric
  • BLOBs
  • Bits
  • UNIQUEIDENTIFIER
  • Cursor Variables
  • Timestamps
DDL INSIGHTS
  • CREATE TABLE
  • Dropping Objects
  • CREATE INDEX
  • TEMPORARY OBJECTS
  • Object Naming and Dependencies
DML INSIGHTS
  • INSERT
  • UPDATE
  • DELETE
  • Detecting DML Errors
SELECT STATEMENTS
  • Simple SELECTs
  • Calculated and Derived Fields
  • SELECT TOP / BOTTOM Records
  • Derived Tables
  • Joins
  • Predicates
  • Subqueries
  • Aggregate Functions
  • GROUP BY and HAVING
  • UNION
  • ORDER BY
WORKING WITH VIEWS
  • ANSI SQL Schema VIEWs
  • Getting a VIEW's Source Code
  • Updatable VIEWs
  • Derived Tables
  • Dynamic VIEWs
  • Partitioning Data Using Views
  • View Restrictions
  1. Power BI Desktop

    Free & Downloadable from Microsoft Store App

    https://www.microsoft.com/store/productid/9NTXR16HNW1T?ocid=pdpshare

  2. Excel 2016 & above with PowerPivot

    Available with Office 365 subscriptions that include desktop versions of Excel for Windows.

  3. MS-SQL Server

    https://www.microsoft.com/en-in/sql-server/sql-server-downloads

    Kindly install Developer Edition as it is full-featured free edition, licensed for use as a development and test database in a non-production environment.

  4. SQL Server Management Studio (SSMS)

    Download and install SSMS from https://learn.microsoft.com/en-us/sql/ssms/download-sql-server-management-studio-ssms?view=sql-server-ver16

Training Schedule

Available Slots

Session Date Time

Course Fee

£699

What is included?

  • 18 hours of Instructor-led training.
  • Power BI & Power Query Projects and related case studies.
  • 30-Days post-training support (via Email).
  • BI Reporting Specialist Certificate
View Certificate

Connect with Us

Daniel Carter

Business Associate

Tel: +44 (0)20 3769 3689

Email: support@excelgoodies.uk

Connect us on

About Your Trainer

Mr. Sami

MCT, MCP, MEE, MOS

30,000+

Students Trained

18+

Year of Experience

4.9

Reviews

Mr. Sami is an exceptionally accomplished and certified Microsoft Trainer, possessing extensive expertise in the fields of Finance, HR, and Information Technology. With an impressive 14-year tenure in the industry, he has successfully trained and empowered over 23,000 professionals, and the number continues to grow.

He has undertaken assignments with the renowned IRS, The World Bank, Tata Chemicals, Buckman Laboratories, Standard Chartered, ING Barings and much more. His nature of going that Extra Mile has got him the startling popularity amongst the Excelgoodies prominent clients.

With his wealth of knowledge and dedication to delivering exceptional training experiences, Mr. Sami consistently exceeds the expectations of his clients and leaves a lasting impact on the professionals he trains.

Mr. Sami is an exceptionally accomplished and certified Microsoft Trainer, possessing extensive expertise in the fields of Finance, HR, and Information Technology. With an impressive 14-year tenure in the industry, he has successfully trained and empowered over 23,000 professionals, and the number continues to grow.

Throughout his illustrious career, Mr. Sami has collaborated with esteemed organizations such as the IRS, The World Bank, Mercedez-Benz, Comcast, Standard Chartered, and ING Barings, to name just a few. His unwavering commitment to going the extra mile has earned him a stellar reputation among Excelgoodies' prominent clients.

With his wealth of knowledge and dedication to delivering exceptional training experiences, Mr. Sami consistently exceeds the expectations of his clients and leaves a lasting impact on the professionals he trains.

Course Content Overview

A snapshot of what you'll be learning in 2 weeks

Introduction to PowerBI Building Blocks of Power BI
  • Visualizations
  • Datasets
  • Reports
  • Dashboards
  • Tiles
Getting Comfortable With Power BI
Environment
  • Connect to Data Sources in Power BI Desktop
  • Cleaning Irregularly Formatted Date and Transform Your Data With the Query Editor
  • Create a report in Power BI Desktop
  • Publish the report in the Power BI service
Data Modelling with Power BI
  • Fundamentals of Modelling
  • How to Manage Your Data Relationships
  • Create Calculated Columns
  • Optimizing Data Models for Better Visuals
  • Create measures and work with time-based functions
  • Create Calculated Tables
  • Explore Time-Based Data
Visualizations
  • Create and Customize Simple Visualizations
  • How to Use Combination Charts
  • Using slicers
  • Creating Map Visualizations
  • Creating Tables and Matrixes
  • Creating Scatter Charts
  • Creating Waterfall and Funnel Charts
  • Using Gauges and Single Number Cards
  • Charting Options including Formatting with Colors, Shapes, Text Boxes, Images, etc.
  • Creating Interactions Between Visualizations
  • Visual hierarchies and drill-down behaviour
Exploring Data
  • Exploring Data
  • Use Quick Insights in the Power BI service
  • Create and Configure A Dashboard
  • Ask Questions of Your Data With Natural Language
  • Share Dashboards with your organization
  • Display Visuals and Tiles Full-Screen
Power BI and Excel
  • Power BI and Excel
  • Import an Excel table into Power BI
  • Import Excel files with data models and Power View sheets
  • Connect OneDrive for Business to Power BI
  • Excel data in Power BI summary
Publishing and Sharing
  • Publishing and Sharing
  • Publish Reports from Power BI Desktop to the Power BI Service
  • Print and export Power BI dashboards
  • Manually Republish and Refresh Your Data
  • Introducing Power BI Mobile
  • Create a group in Power BI
  • Create a content pack in Power BI
  • Connect to a content pack from a group in Power BI
  • Edit a content pack in Power BI
  • Integrate OneDrive for Business with Power BI
  • Publish a report to the web from Power BI
Introduction to PowerPivot
  • Limitation of Excel Functions
  • Limitation of Excel PivotTable
  • Why PowerPivot?
  • PowerPivot Features - Overview
PowerPivot Environment
  • Opening PowerPivot Environment
  • Understanding External Data Section
  • Understanding Formatting
  • PowerPivot Views
  • Understanding Measures
Taking Data into PowerPivot
  • From Excel
  • From MS Access
  • From Ms-SQL
  • From Custom Query
  • From Text Files
  • From Other Sources
Calculated Columns
  • Calculated Columns
  • Entering Formulas
  • Using AutoComplete Feature
  • Renaming Columns
  • Understanding Tables
Creating Measures
  • Creating Simple DAX Measures
  • Explicit Measure Vs Implicit Measure
  • Referencing Measures in Other Measures
  • Formatting Measures
Manage Data Relationships Working with Multiple Tables Disconnected Tables Creating custom calendars using
ADVANCED FILTER()
Advanced calculated columns
  • Understanding Relationship Concept
  • JOIN TABLES
  • LEFT JOIN TABLES
  • RIGHT JOIN TABLES
  • Using UNION QUERIES
Data visualization Using
  • Power View
  • Charts, Score Cards and Dashboards
  • Slicers
  • Map Visualizations
  • Data Binding and Formatting
Creating Advanced Dashboards with
PowerPivot
Introduction to Microsoft Power Query
for Excel
Import data from external data sources Import with Standard Connectors
  • Connect to a Text or CSV file
  • Connect to a Web page
  • Connect to an Excel Table/Range
Import Data from a File
  • Connect to an Excel workbook
  • Connect to a Text or CSV file
  • Connect to an XML file
  • Connect to a JSON file
Import Data from a Database
  • Connect to a SQL Server database
  • Connect to an Access database
  • Connect to a MySQL database
Import Data from Online Services
  1. Connect to Salesforce Objects
  2. Connect to a Sharepoint Online List
  3. Connect to Facebook
Import Data from Other Sources
  • Connect to an Excel Table or Range
  • Connect to a Web page
Shape data from Multiple Data Sources
  • Shape or transform a query
  • Refresh a query
  • Combine data from multiple data sources
  • Filter a table
  • Sort a table
  • Group rows in a table
  • Expand a column containing an associated table
  • Aggregate data from a column
  • Insert a custom column into a table
  • Combine multiple queries
  • Merge columns
  • Remove columns
  • Remove rows with errors
  • Promote a row to column headers
  • Split a column of text
  • Insert a query to the worksheet
Performing Calculations using DAX Functions
  • Table-Valued Functions
  • Date and Time Functions
  • Filter Functions
  • Information Functions
  • Logical Functions
  • Mathematical and Trigonometric Functions
  • Statistical Functions
  • Text Functions
  • Time Intelligence Functions
Creating Advanced DAX Measures with
Advanced DAX Functions
  • Calculate()
  • All()
  • Filter()
  • IF()
  • Switch()
  • SumX()
Introduction to MS-SQL
  • Creating a Database
  • Understanding Tables and Creating Tables
  • Inserting, Updating and Deleting Data
  • Querying Data
  • Filtering Data
  • Grouping Data
  • Ordering Data
  • Column Aliases
  • Table Aliases
UNDERSTANDING TRANSACT-SQL DATA TYPES
  • Dates
  • Strings
  • Numeric
  • BLOBs
  • Bits
  • UNIQUEIDENTIFIER
  • Cursor Variables
  • Timestamps
DDL INSIGHTS
  • CREATE TABLE
  • Dropping Objects
  • CREATE INDEX
  • TEMPORARY OBJECTS
  • Object Naming and Dependencies
DML INSIGHTS
  • INSERT
  • UPDATE
  • DELETE
  • Detecting DML Errors
SELECT STATEMENTS
  • Simple SELECTs
  • Calculated and Derived Fields
  • SELECT TOP / BOTTOM Records
  • Derived Tables
  • Joins
  • Predicates
  • Subqueries
  • Aggregate Functions
  • GROUP BY and HAVING
  • UNION
  • ORDER BY
WORKING WITH VIEWS
  • ANSI SQL Schema VIEWs
  • Getting a VIEW's Source Code
  • Updatable VIEWs
  • Derived Tables
  • Dynamic VIEWs
  • Partitioning Data Using Views
  • View Restrictions

Objective: Get hands-on experience with advanced administration settings, permissions, Data refresh times etc.

Overview

  • Publishing Power BI Reports
  • Creating & Managing Workspaces and Its Access
  • Creating & Managing Dashboard and Its Access
  • Installing & Configuring Data gateway
  • Scheduling and configuring data refresh
  • Managing & Reusing Datasets
  • Scheduling Report Alerts
  • Setting up Row Level Permissions
  • Managing Users & Audit Log
  • Custom Branding Power BI For your Organization
  • Adding Custom Visuals for your Organization

Objective: It complements Power Pivots and Power BI better than any other DB.

INTRODUCTION TO MS-SQL

  • Creating a Database
  • Understanding Tables and Creating Tables
  • Inserting, Updating and Deleting Data
  • Querying Data
  • Filtering Data
  • Grouping Data
  • Ordering Data
  • Column Aliases
  • Table Aliases

UNDERSTANDING TRANSACT-SQL DATA TYPES

  • Dates
  • Strings
  • Numeric
  • BLOBs
  • Bits
  • UNIQUEIDENTIFIER
  • Cursor Variables
  • Timestamps

DDL INSIGHTS

  • CREATE TABLE
  • Dropping Objects
  • CREATE INDEX
  • TEMPORARY OBJECTS
  • Object Naming and Dependencies

SELECT STATEMENTS

  • Simple SELECTs
  • Calculated and Derived Fields
  • SELECT TOP / BOTTOM Records
  • Derived Tables
  • Joins
  • Predicates
  • Subqueries
  • Aggregate Functions
  • GROUP BY and HAVING
  • UNION
  • ORDER BY

Objective: To put our entire learning to use and arrive at the best possible BI solution -using the right combination of available technologies.

Overview

  • Case Study 1
  • Case Study 2
  • Case Study 3

System Requirements

  1. Power BI Desktop

    Free & Downloadable from Microsoft Store App

    https://www.microsoft.com/store/productid/9NTXR16HNW1T?ocid=pdpshare

  2. Excel 2016 & above with PowerPivot

    Available with Office 365 subscriptions that include desktop versions of Excel for Windows.

  3. MS-SQL Server

    https://www.microsoft.com/en-in/sql-server/sql-server-downloads

    Kindly install Developer Edition as it is full-featured free edition, licensed for use as a development and test database in a non-production environment.

  4. SQL Server Management Studio (SSMS)

    Download and install SSMS from https://learn.microsoft.com/en-us/sql/ssms/download-sql-server-management-studio-ssms?view=sql-server-ver16

Course Fee

£699

What is included?

  • 18 hours of Instructor-led training.
  • Power BI & Power Query Projects and related Case Studies.
  • 30-Days post-training support (via Email).
  • BI Reporting Specialist Certificate
View Certificate
*

These advanced concepts are part of our Full Stack BI course and are available for an additional cost, in addition to the regular Power BI course.

READY TO BE CERTIFIED AS A

BI Reporting Specialist?

Training Schedule

Available Slots

Session Date Time

Certifications

Data Analysis & Dashboard Associate Using Power BI
Eligibility:
On clearing post-training assessment.
View Sample Certificate

Connect with Us

Daniel Carter

Business Associate

Tel: +44 (0)20 3769 3689

Email: support@excelgoodies.uk

Connect us on

About Your Trainer

Mr. Sami

MCT, MCP, MEE, MOS

30,000+

Students Trained

18+

Year of Experience

4.9

Reviews

Mr. Sami is an exceptionally accomplished and certified Microsoft Trainer, possessing extensive expertise in the fields of Finance, HR, and Information Technology. With an impressive 14-year tenure in the industry, he has successfully trained and empowered over 23,000 professionals, and the number continues to grow.

He has undertaken assignments with the renowned IRS, The World Bank, Tata Chemicals, Buckman Laboratories, Standard Chartered, ING Barings and much more. His nature of going that Extra Mile has got him the startling popularity amongst the Excelgoodies prominent clients.

With his wealth of knowledge and dedication to delivering exceptional training experiences, Mr. Sami consistently exceeds the expectations of his clients and leaves a lasting impact on the professionals he trains.

Mr. Sami is an exceptionally accomplished and certified Microsoft Trainer, possessing extensive expertise in the fields of Finance, HR, and Information Technology. With an impressive 14-year tenure in the industry, he has successfully trained and empowered over 23,000 professionals, and the number continues to grow.

Throughout his illustrious career, Mr. Sami has collaborated with esteemed organizations such as the IRS, The World Bank, Mercedez-Benz, Comcast, Standard Chartered, and ING Barings, to name just a few. His unwavering commitment to going the extra mile has earned him a stellar reputation among Excelgoodies' prominent clients.

With his wealth of knowledge and dedication to delivering exceptional training experiences, Mr. Sami consistently exceeds the expectations of his clients and leaves a lasting impact on the professionals he trains.

Why Power BI skill is highly sought after?

ExcelGoodies

GBP 90,000

is the annual average salary of

Data Scientist using Power BI

ExcelGoodies

2,50,000

Companies have

implemented Power BI

ExcelGoodies

97%

Fortune 500 Companies use

Power BI

ExcelGoodies

Top Leader

in Analytics & BI for 14th

Consecutive Year.

Source:

ExcelGoodies ExcelGoodies ExcelGoodies

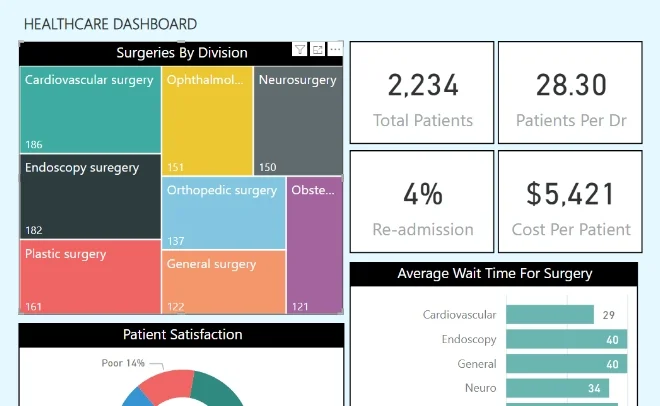
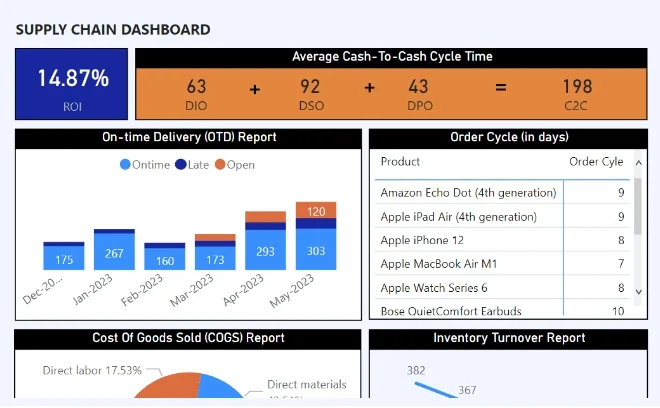
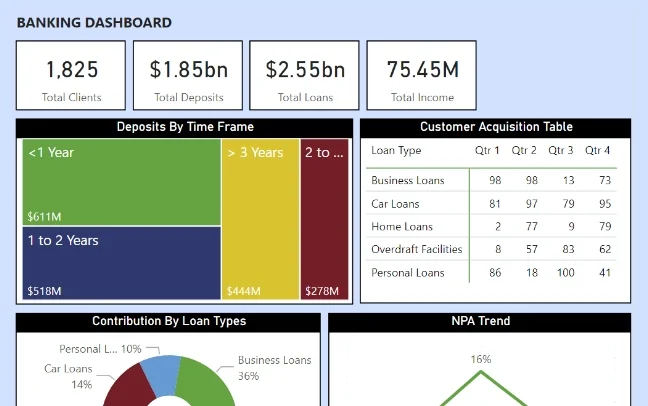
Few Real­world Use Cases of Power BI Reporting

Power BI Use Cases Across Industries: Finance to Healthcare.

READY TO BE CERTIFIED AS A

BI Reporting Specialist?

Few Real­world Use Cases of Power BI Reporting

Power BI Use Cases Across Industries: Finance to Healthcare.

Learner stories around
the world

Total Reviews

4583

Overall growth till now

Average Rating

4.9

Average rating this year

Graph

5

2.0K

4

1.0K

3

500

2

200

1

0

Star Rating

Trainer's Expertise

Course Structure

Course Content

Assignments

Certification Process

Excelgoodies

Susan Rodezno

Power BI Training

Analyst, Process Improvement, Corporate Budgeting & Reporting

Essex Property Trust

United States

Sami's very knowledgeable and professional and clearly an expert in what he does. He was patient with us and provided us with a lot of content, giving us the tools to succeed while not giving away the farm sot to speak. I feel like I learned a great deal and looking forward to going back to reference material as well as completing the project for this class completion. thank you,

Excelgoodies

Tao Peng

Power BI Training

Information Technology Specialist

Minnesota State College Southeast

United States

This is an excellent training. Sami is a great and patient instructor. He made sure everyone is on course and understands the topic fully before he moves on, if help is needed beyond class time, he also was there before the class to answer questions. I am really impressed with his knowledge and expertise, it seems he always knows the answer to questions. I will definitely take another class with Sami and Excelgoodies again.

Excelgoodies

Iris Bradshaw

Power BI Training

Data Analyst

Qnnect

United States

I had a little experience with Power BI prior to the class. The information given greatly expanded my knowledge and I am excited to put the knowledge to use. Sami's instructions were very easy to follow and he made sure to answer everyone's questions. The only issue I had with the course was with the students not the instructor or course itself. It was a bit frustrating when some of the students were not prepared (especially not having the system requirements installed) and we had to wait for them to download materials or software. Sami handled it professionally but it took away time that could have been used for training. Overall, I am very please with what I have learned and will be looking into taking the Full Stack BI training. Thank You, Iris Bradshaw

Learner stories
around the world

Total Reviews

4583

Overall growth till now

Average Rating

4.9

Average rating this year

Industry Insights

ExcelGoodies

Power BI

7 Advanced DAX Functions to Supercharge Your Power BI Reports

ExcelGoodies

Power BI

Creating Mobile-Friendly Reports with Power BI

ExcelGoodies

Power BI

The Fast-Food Chain Data Story with Power BI: Do’s & Don’ts of data storytelling

Recommended Course (For Advanced Reporting Users Only)

Full Stack BI
Reporting & Automation Course.

72 Sessions | 9-Specialist Certifications

You will learn to use the right and hybrid technology for end-to-end advanced power reporting.

Tools: Power BI, Power Pivot, VBA, Excel,
M-Programming, MS-SQL, SSIS, and many more.

Excelgoodies

Power BI

Excelgoodies

Micorsoft T-SQL

Excelgoodies

MS-SQL Integrated Services

Excelgoodies

Python

Excelgoodies

Microsoft Excel VBA

Excelgoodies

MS-Excel

Excelgoodies

Power Query